Grundläggande statistik
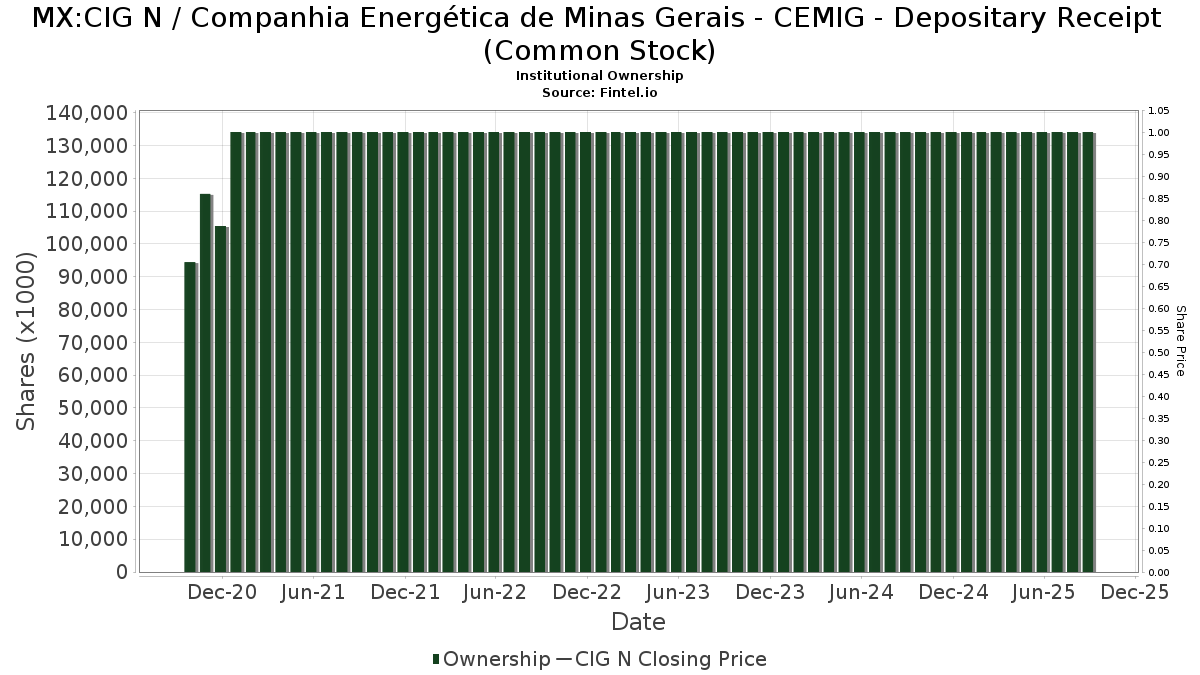
| Institutionella ägare | 199 total, 198 long only, 0 short only, 1 long/short - change of −4,86% MRQ |
| Genomsnittlig portföljallokering | 0.1046 % - change of 2,46% MRQ |
| Institutionella aktier (lång) | 130 123 433 (ex 13D/G) - change of 19,42MM shares 16,93% MRQ |
| Institutionellt värde (lång) | $ 261 173 USD ($1000) |
Institutionellt ägande och aktieägare
Companhia Energética de Minas Gerais - CEMIG - Depositary Receipt (Common Stock) (MX:CIG N) har 199 Institutionella ägare och aktieägare som har lämnat in 13D/G- eller 13F-formulär till Securities Exchange Commission (SEC). Dessa institut innehar totalt 130,123,433 aktier. Största aktieägare inkluderar BlackRock, Inc., Goldman Sachs Group Inc, State Street Corp, Vanguard Group Inc, Renaissance Technologies Llc, VGTSX - Vanguard Total International Stock Index Fund Investor Shares, American Century Companies Inc, VEIEX - Vanguard Emerging Markets Stock Index Fund Investor Shares, Crossmark Global Holdings, Inc., and Morgan Stanley .
Companhia Energética de Minas Gerais - CEMIG - Depositary Receipt (Common Stock) (BMV:CIG N) Institutionell ägarstruktur visar institutioners och fonders nuvarande positioner i företaget, samt de senaste förändringarna i positionernas storlek. Större aktieägare kan vara enskilda investerare, fonder, hedgefonder eller institutioner. Bilaga 13D visar att investeraren äger (eller ägde) mer än 5% av företaget och avser (eller avsåg) att aktivt eftersträva en förändring av affärsstrategin. Schedule 13G indikerar en passiv investering på över 5%.
Fondsentimentets poäng
Fondsentimentet poängen(fka Ägarackumulation-poäng) visar vilka aktier som är mest köpta av fonder. Det är resultatet av en sofistikerad kvantitativ flerfaktormodell som identifierar företag med de högsta nivåerna av institutionell ackumulering. Poängsättningsmodellen använder en kombination av den totala ökningen av redovisade ägare, förändringarna i portföljallokeringarna för dessa ägare och andra mått. Siffran sträcker sig från 0 till 100, där högre siffror indikerar en högre nivå av ackumulering i förhållande till sina konkurrenter, och 50 är genomsnittet.
Uppdateringsfrekvens: Dagligen
Se Ownership Explorer, som innehåller en lista över de högst rankade företagen.
AI+ Ask Fintel’s AI assistant about Companhia Energética de Minas Gerais - CEMIG - Depositary Receipt (Common Stock).
Select a question to share a public post with an AI-crafted answer.
Thinking of good questions…
13F- och NPORT-arkiveringar
Detaljer om 13F-arkiveringar är gratis. Detaljer om NP-arkiveringar kräver ett premiummedlemskap. Gröna rader indikerar nya positioner. Röda rader indikerar stängda positioner. Klicka på länk symbolen för att se hela transaktionshistoriken.
Uppgradera
för att låsa upp premiumdata och exportera till Excel ![]() .
.
| Fil Datum | Källa | Investerare | Typ | Genomsnittligt pris (beräknat) |
Aktier | Δ Aktier (%) |
Rapporterat värde (1000 USD) |
Δ Värde (%) |
Portföljallokering (%) |
|
|---|---|---|---|---|---|---|---|---|---|---|
| 2026-02-13 | 13F/A | Virtus ETF Advisers LLC | 0 | −100,00 | 0 | |||||
| 2025-09-25 | NP | DFSE - Dimensional Emerging Markets Sustainability Core 1 ETF | 33 910 | 0,00 | 61 | −4,69 | ||||
| 2026-02-13 | 13F | Marshall Wace, Llp | 0 | −100,00 | 0 | |||||
| 2026-01-05 | 13F | GAMMA Investing LLC | 16 454 | 14,40 | 33 | 6,67 | ||||
| 2026-02-06 | 13F | EverSource Wealth Advisors, LLC | 25 894 | 14,74 | 52 | 8,51 | ||||
| 2026-02-17 | 13F | Royal Bank Of Canada | 246 115 | −2,81 | 493 | −7,85 | ||||
| 2026-02-04 | 13F | Pure Financial Advisors, Inc. | 66 185 | 0,00 | 132 | −5,04 | ||||
| 2026-02-02 | 13F | Qrg Capital Management, Inc. | 137 806 | −9,02 | 276 | −13,79 | ||||
| 2026-02-12 | 13F | Skopos Labs, Inc. | 0 | −100,00 | 0 | |||||
| 2026-02-13 | 13F | Mariner, LLC | 137 778 | −14,96 | 276 | −19,35 | ||||
| 2026-02-13 | 13F | Inspire Advisors, LLC | 15 716 | 55,84 | 31 | 47,62 | ||||
| 2025-09-25 | NP | TWAAX - Thrivent International Allocation Fund Class A | 0 | −100,00 | 0 | −100,00 | ||||
| 2025-09-26 | NP | UBPIX - Ultralatin America Profund Investor Class | 43 139 | 14,07 | 78 | 9,86 | ||||
| 2026-01-23 | 13F | Robeco Institutional Asset Management B.V. | 2 773 413 | 0,00 | 5 547 | −5,21 | ||||
| 2026-02-13 | 13F | State Street Corp | 14 278 481 | 4,23 | 31 827 | 3,73 | ||||
| 2026-02-24 | 13F | DGS Capital Management, LLC | 47 327 | −11,40 | 95 | −16,07 | ||||
| 2026-02-12 | 13F | Investment Research Partners LLC | 36 371 | 4,59 | 73 | 1,41 | ||||
| 2025-11-14 | 13F | Cubist Systematic Strategies, LLC | 58 950 | 124 | ||||||
| 2026-02-03 | 13F | Ethic Inc. | 79 105 | 46,20 | 158 | 38,60 | ||||
| 2026-02-11 | 13F | Simplex Trading, Llc | Call | 0 | −100,00 | 0 | ||||
| 2026-02-17 | 13F | Aqr Capital Management Llc | 834 215 | −25,77 | 1 668 | −29,65 | ||||
| 2026-01-20 | 13F | Signaturefd, Llc | 178 505 | −1,48 | 357 | −6,54 | ||||
| 2026-02-17 | 13F | Northern Trust Corp | 1 700 200 | −11,43 | 3 400 | −16,05 | ||||
| 2026-02-13 | 13F | PCM Encore, LLC | 50 335 | 101 | ||||||
| 2026-01-08 | 13F | True Wealth Design, LLC | 4 | 0,00 | 0 | |||||
| 2026-02-13 | 13F | JustInvest LLC | 38 263 | 4,38 | 77 | −1,30 | ||||
| 2026-02-13 | 13F | Flow Traders U.s. Llc | 32 940 | 0 | ||||||
| 2026-01-21 | 13F | Yousif Capital Management, Llc | 23 272 | 0,00 | 47 | −4,08 | ||||
| 2025-09-25 | NP | VEIEX - Vanguard Emerging Markets Stock Index Fund Investor Shares | 4 339 107 | 0,00 | 7 854 | −4,23 | ||||
| 2026-02-13 | 13F | Ubs Asset Management Americas Inc | 5 290 | 11 | ||||||
| 2026-02-13 | 13F | Squarepoint Ops LLC | 10 462 | −89,18 | 21 | −90,20 | ||||
| 2026-02-04 | 13F | Argos Wealth Advisors, LLC | 18 935 | 38 | ||||||
| 2026-02-12 | 13F | Quadrant Capital Group Llc | 299 997 | −0,16 | 600 | −5,36 | ||||
| 2025-11-10 | 13F | Optiver Holding B.V. | 0 | −100,00 | 0 | |||||
| 2025-09-24 | NP | SGIDX - Steward Global Equity Income Fund Class A | 3 997 | −3,43 | ||||||
| 2025-09-23 | NP | GERIX - Goldman Sachs Emerging Markets Equity Insights Fund Institutional | 118 300 | −12,69 | 214 | −16,41 | ||||
| 2026-01-15 | 13F | Allspring Global Investments Holdings, LLC | 10 793 | 22 | ||||||
| 2026-02-17 | 13F | Virtus Investment Advisers, Inc. | 82 538 | −1,04 | 165 | −5,71 | ||||
| 2026-02-17 | 13F | SageView Advisory Group, LLC | 854 | 2 | ||||||
| 2026-02-12 | 13F | Federation des caisses Desjardins du Quebec | 2 347 | 0,00 | 5 | 0,00 | ||||
| 2026-01-16 | 13F | Perigon Wealth Management, LLC | 159 131 | 318 | ||||||
| 2026-02-17 | 13F | Jones Financial Companies Lllp | 774 | −25,93 | 2 | −50,00 | ||||
| 2026-02-02 | 13F | Principal Financial Group Inc | 207 165 | 8,98 | 414 | 3,24 | ||||
| 2026-02-06 | 13F | Pzena Investment Management Llc | 1 080 784 | −46,29 | 2 162 | −49,09 | ||||
| 2026-02-19 | 13F | Invesco Ltd. | 290 829 | −21,16 | 582 | −25,32 | ||||
| 2026-02-03 | 13F/A | Mount Yale Investment Advisors, LLC | 0 | −100,00 | 0 | |||||
| 2026-01-27 | 13F | PFG Advisors | 18 392 | 0,00 | 37 | −5,26 | ||||
| 2026-02-17 | 13F | Quadrature Capital Ltd | 0 | −100,00 | 0 | |||||
| 2026-02-06 | 13F | Profund Advisors Llc | 49 768 | 31,69 | 100 | 25,32 | ||||
| 2026-02-13 | 13F | Caitong International Asset Management Co., Ltd | 22 505 | 4 114,42 | 45 | 4 400,00 | ||||
| 2025-09-25 | NP | VEU - Vanguard FTSE All-World ex-US Index Fund ETF Shares | 980 613 | 0,00 | 1 775 | −4,26 | ||||
| 2026-02-17 | 13F | Public Employees Retirement System Of Ohio | 379 734 | 0,00 | 759 | −5,24 | ||||
| 2026-02-06 | 13F | Banque Cantonale Vaudoise | 222 296 | 5,54 | 445 | |||||
| 2026-01-26 | 13F | Mirae Asset Global Investments Co., Ltd. | 103 450 | 2,31 | 207 | −3,29 | ||||
| 2026-02-18 | 13F | Vident Advisory, LLC | 510 489 | 0,48 | 1 021 | −4,76 | ||||
| 2026-01-07 | 13F | Hilltop National Bank | 8 000 | 0,00 | 16 | 0,00 | ||||
| 2026-02-13 | 13F | National Bank Of Canada /fi/ | 18 864 | −30,19 | 38 | −33,93 | ||||
| 2026-02-02 | 13F | Truist Financial Corp | 26 041 | −5,12 | 52 | −8,77 | ||||
| 2026-02-10 | 13F | Connor, Clark & Lunn Investment Management Ltd. | 2 248 460 | 0,09 | 4 497 | −5,13 | ||||
| 2025-09-25 | NP | DEXC - Dimensional Emerging Markets ex China Core Equity ETF | 33 600 | 0,00 | 61 | −4,76 | ||||
| 2026-02-11 | 13F | Metis Global Partners, LLC | 137 662 | 0,00 | 275 | −5,17 | ||||
| 2026-02-12 | 13F | Banco BTG Pactual S.A. | 0 | −100,00 | 0 | |||||
| 2026-01-30 | 13F | Simplicity Wealth,LLC | 10 918 | 22 | ||||||
| 2025-09-25 | NP | DFEM - Dimensional Emerging Markets Core Equity 2 ETF | 116 130 | 0,00 | 210 | −4,11 | ||||
| 2026-01-29 | 13F | Vanguard Group Inc | 13 098 258 | 0,00 | 26 197 | −5,21 | ||||
| 2026-02-12 | 13F | Raiffeisen Bank International AG | 85 266 | −13,62 | 174 | −16,83 | ||||
| 2026-02-17 | 13F | Bank Of America Corp /de/ | 1 981 673 | 236,87 | 3 963 | 219,34 | ||||
| 2025-09-25 | NP | VGTSX - Vanguard Total International Stock Index Fund Investor Shares | 5 197 706 | 0,00 | 9 408 | −4,23 | ||||
| 2026-02-11 | 13F | Franklin Resources Inc | 272 751 | 5,33 | 546 | −0,18 | ||||
| 2026-01-26 | 13F | Harbor Asset Planning, Inc. | 8 036 | 0,00 | 16 | 0,00 | ||||
| 2026-02-06 | 13F | Global Retirement Partners, LLC | 88 685 | 65 592,59 | 177 | |||||
| 2026-02-10 | 13F | Welch & Forbes Llc | 0 | −100,00 | 0 | |||||
| 2025-09-25 | NP | DFA INVESTMENT DIMENSIONS GROUP INC - Emerging Markets Sustainability Core 1 Portfolio Institutional Class This fund is a listed as child fund of Dimensional Fund Advisors Lp and if that institution has disclosed ownership in this security, then these positions will not be double counted when calculating total shares and total value | 11 963 | 0,00 | 22 | −4,55 | ||||
| 2026-01-30 | 13F | Valued Wealth Advisors LLC | 1 329 | 0,00 | 3 | 0,00 | ||||
| 2026-02-06 | 13F | HighTower Advisors, LLC | 135 858 | −3,43 | 272 | −8,45 | ||||
| 2026-02-24 | 13F | Bell Investment Advisors, Inc | 1 020 | 0,00 | 2 | 0,00 | ||||
| 2026-02-13 | 13F | Rhumbline Advisers | 33 589 | 0,67 | 67 | −4,29 | ||||
| 2026-02-13 | 13F | First Trust Advisors Lp | 11 988 | −36,40 | 24 | −41,03 | ||||
| 2025-10-08 | 13F/A | New York State Common Retirement Fund | 0 | −100,00 | 0 | −100,00 | ||||
| 2026-02-12 | 13F | Hrt Financial Lp | 0 | −100,00 | 0 | |||||
| 2026-02-11 | 13F | IMA Wealth, Inc. | 383 | 1 | ||||||
| 2026-02-13 | 13F | Mml Investors Services, Llc | 32 095 | −4,39 | 64 | −8,57 | ||||
| 2026-02-17 | 13F | Two Sigma Securities, Llc | 34 793 | 203,60 | 70 | 187,50 | ||||
| 2026-02-12 | 13F | Qtron Investments LLC | 0 | −100,00 | 0 | |||||
| 2026-02-09 | 13F | Legal & General Group Plc | 1 421 852 | 0,00 | 2 851 | −4,30 | ||||
| 2026-01-21 | 13F | Prime Capital Investment Advisors, LLC | 57 741 | −1,00 | 115 | −6,50 | ||||
| 2026-02-13 | 13F | Sei Investments Co | 207 021 | −14,50 | 414 | −18,82 | ||||
| 2026-01-20 | 13F | AdvisorNet Financial, Inc | 2 413 | 0,00 | 5 | −20,00 | ||||
| 2026-02-17 | 13F | Grantham, Mayo, Van Otterloo & Co. LLC | 717 492 | 0,00 | 1 435 | −5,22 | ||||
| 2026-02-17 | 13F | Mercer Global Advisors Inc /adv | 47 409 | −11,07 | 95 | −16,07 | ||||
| 2026-02-18 | 13F | Mackenzie Financial Corp | 424 174 | −18,32 | 864 | −21,19 | ||||
| 2026-01-16 | 13F | Ronald Blue Trust, Inc. | 73 752 | −16,26 | 148 | −20,54 | ||||
| 2025-11-12 | 13F | Simplex Trading, Llc | 0 | −100,00 | 0 | |||||
| 2026-02-13 | 13F | MAI Capital Management | 1 540 | 0,00 | 3 | 0,00 | ||||
| 2026-02-10 | 13F | Acadian Asset Management Llc | 0 | −100,00 | 0 | |||||
| 2025-11-12 | 13F | Barclays Plc | 0 | −100,00 | 0 | |||||
| 2026-01-29 | 13F | UBS Group AG | 203 395 | −85,33 | 407 | −86,12 | ||||
| 2026-02-03 | 13F | Sequoia Financial Advisors, LLC | 56 668 | 0,68 | 113 | −4,24 | ||||
| 2026-02-13 | 13F | Arrowstreet Capital, Limited Partnership | 825 893 | −41,62 | 1 652 | −44,69 | ||||
| 2026-01-26 | 13F | Abundance Wealth Counselors | 68 157 | 9,96 | 136 | 4,62 | ||||
| 2025-09-29 | NP | VRAI - Virtus Real Asset Income ETF | 89 354 | 5,60 | 162 | 1,26 | ||||
| 2025-10-27 | 13F | First Horizon Corp | 0 | −100,00 | 0 | |||||
| 2026-02-17 | 13F | Ameriprise Financial Inc | 27 767 | 0,00 | 56 | −5,17 | ||||
| 2026-02-19 | 13F | Atomi Financial Group, Inc. | 57 919 | 47,25 | 116 | 40,24 | ||||
| 2026-01-21 | 13F | TSP Capital Management Group, LLC | 18 106 | −5,99 | ||||||
| 2026-02-13 | 13F | Pinnacle Wealth Planning Services, Inc. | 25 539 | 0,00 | 51 | −3,77 | ||||
| 2026-02-17 | 13F | Cetera Investment Advisers | 10 758 | 22 | ||||||
| 2026-01-23 | 13F | Eagle Bay Advisors LLC | 16 000 | 32 | ||||||
| 2026-01-26 | 13F | Invested Advisors | 25 517 | 33,63 | 51 | 50,00 | ||||
| 2026-02-17 | 13F | Laird Norton Trust Company, Llc | 232 255 | 498 | ||||||
| 2026-02-11 | 13F | Parallel Advisors, LLC | 9 245 | 0,00 | 18 | −5,26 | ||||
| 2026-02-03 | 13F | SBI Securities Co., Ltd. | 33 493 | 75,13 | 67 | 65,00 | ||||
| 2026-02-13 | 13F | Wells Fargo & Company/mn | 4 752 | 44,26 | 10 | 50,00 | ||||
| 2026-02-13 | 13F | American Century Companies Inc | 5 139 632 | 14,52 | 10 279 | 8,55 | ||||
| 2026-01-26 | 13F | Cwm, Llc | 2 407 | −42,44 | 0 | |||||
| 2026-02-11 | 13F | Cerity Partners LLC | 48 288 | −3,55 | 97 | −8,57 | ||||
| 2026-02-02 | 13F | Ativo Capital Management LLC | 586 421 | −5,19 | 1 173 | −10,19 | ||||
| 2025-11-04 | 13F | Gitterman Wealth Management, LLC | 161 340 | 9,22 | 340 | 17,65 | ||||
| 2026-02-17 | 13F | Two Sigma Investments, Lp | 745 999 | −27,35 | 1 492 | −31,16 | ||||
| 2025-11-12 | 13F | LPL Financial LLC | 0 | −100,00 | 0 | −100,00 | ||||
| 2026-02-13 | 13F | Dodge & Cox | 15 000 | 0,00 | 30 | −3,23 | ||||
| 2026-02-12 | 13F | Principal Securities, Inc. | 0 | −100,00 | 0 | −100,00 | ||||
| 2026-02-17 | 13F | Evergreen Wealth Solutions, LLC | 30 176 | 21,69 | 60 | 15,38 | ||||
| 2026-02-06 | 13F | Pnc Financial Services Group, Inc. | 46 638 | 2,66 | 93 | −2,11 | ||||
| 2026-02-17 | 13F | Citadel Advisors Llc | Put | 10 000 | 20 | |||||
| 2026-02-17 | 13F | Two Sigma Advisers, Lp | 139 990 | −7,62 | 280 | −12,54 | ||||
| 2026-02-17 | 13F | Citadel Advisors Llc | 249 422 | −78,17 | 499 | −79,34 | ||||
| 2026-01-30 | 13F | Precision Wealth Strategies, LLC | 63 668 | −19,18 | 127 | −23,49 | ||||
| 2026-02-17 | 13F | Engineers Gate Manager LP | 0 | −100,00 | 0 | |||||
| 2026-02-10 | 13F | Greenspring Advisors, LLC | 14 832 | 30 | ||||||
| 2026-02-17 | 13F | DZ BANK AG Deutsche Zentral Genossenschafts Bank, Frankfurt am Main | 587 500 | 1 175 | ||||||
| 2026-01-05 | 13F | Park Avenue Securities Llc | 0 | −100,00 | 0 | |||||
| 2025-09-25 | NP | DFA INVESTMENT DIMENSIONS GROUP INC - World ex U.S. Core Equity Portfolio Institutional Class Shares | 12 652 | 0,00 | 23 | −4,35 | ||||
| 2026-02-19 | 13F | CI Private Wealth, LLC | 594 303 | 0,81 | 1 190 | −4,34 | ||||
| 2025-09-25 | NP | DFAE - Dimensional Emerging Core Equity Market ETF | 418 570 | 0,00 | 758 | −4,30 | ||||
| 2026-01-13 | 13F | Stableford Capital Ii Llc | 38 225 | 0,00 | 76 | −5,00 | ||||
| 2026-01-23 | 13F | Farther Finance Advisors, LLC | 348 457 | 1,48 | 697 | −3,87 | ||||
| 2026-02-13 | 13F | Candriam Luxembourg S.C.A. | 47 797 | 91,36 | 96 | 82,69 | ||||
| 2026-02-10 | 13F | Envestnet Asset Management Inc | 116 091 | −95,10 | 232 | −95,36 | ||||
| 2026-02-11 | 13F | SmartHarvest Portfolios, LLC | 14 952 | 30 | ||||||
| 2026-02-13 | 13F | Manufacturers Life Insurance Company, The | 0 | −100,00 | 0 | |||||
| 2026-02-12 | 13F | Brown Brothers Harriman & Co | 1 871 | 107,43 | 4 | 200,00 | ||||
| 2026-02-17 | 13F | D. E. Shaw & Co., Inc. | 204 419 | −43,93 | 409 | −46,94 | ||||
| 2026-02-11 | 13F | Jpmorgan Chase & Co | 17 727 | −94,14 | 35 | −94,51 | ||||
| 2026-02-17 | 13F | Susquehanna International Group, Llp | Call | 54 500 | 74,68 | 109 | 67,69 | |||
| 2026-02-17 | 13F | Tower Research Capital LLC (TRC) | 16 621 | 534,63 | 33 | 560,00 | ||||
| 2026-01-16 | 13F | Vanguard Capital Wealth Advisors This fund is a listed as child fund of Vanguard Group Inc and if that institution has disclosed ownership in this security, then these positions will not be double counted when calculating total shares and total value | 50 300 | 42,49 | 101 | 35,14 | ||||
| 2026-02-12 | 13F | Canopy Partners, LLC | 0 | −100,00 | 0 | |||||
| 2026-02-17 | 13F | Guggenheim Capital Llc | 629 791 | 3,58 | 1 260 | −1,79 | ||||
| 2026-02-17 | 13F | Fmr Llc | 30 800 | −0,72 | 62 | −6,15 | ||||
| 2026-01-08 | 13F | Traveka Wealth, LLC | 12 725 | 0,00 | 25 | −3,85 | ||||
| 2025-11-12 | 13F | Steward Partners Investment Advisory, Llc | 0 | −100,00 | 0 | |||||
| 2026-02-17 | 13F | Susquehanna International Group, Llp | 137 983 | 227,74 | 276 | 212,50 | ||||
| 2026-02-13 | 13F | Itau Unibanco Holding S.A. | 0 | −100,00 | 0 | |||||
| 2026-02-10 | 13F | Bnp Paribas Arbitrage, Sa | 41 034 | 0,00 | 82 | −4,65 | ||||
| 2026-02-17 | 13F | Mangrove Partners | 2 625 000 | −42,93 | 5 250 | −45,91 | ||||
| 2026-02-11 | 13F | Group One Trading, L.p. | Call | 4 700 | −77,40 | 9 | −79,07 | |||
| 2026-02-11 | 13F | Group One Trading, L.p. | 2 802 | −63,98 | 6 | −68,75 | ||||
| 2026-02-11 | 13F | Longfellow Investment Management Co Llc | 463 490 | −13,28 | 927 | −17,83 | ||||
| 2026-03-04 | 13F | Rehmann Capital Advisory Group | 0 | −100,00 | 0 | |||||
| 2026-02-13 | 13F | Pathstone Holdings, LLC | 83 589 | 1,87 | 167 | −3,47 | ||||
| 2026-02-05 | 13F | Abacus Wealth Partners, LLC | 10 113 | 20 | ||||||
| 2026-02-23 | 13F | Leonteq Securities AG | 0 | −100,00 | 0 | |||||
| 2026-02-04 | 13F | Blackhawk Capital Partners LLC. | 24 337 | 0,00 | 49 | −5,88 | ||||
| 2026-02-03 | 13F | Crossmark Global Holdings, Inc. | 4 061 011 | 1,59 | 8 122 | −3,70 | ||||
| 2026-02-17 | 13F | CWM Advisors, LLC | 4 423 | 9 | ||||||
| 2026-02-10 | 13F/A | Northwestern Mutual Wealth Management Co | 9 132 | 0,00 | 18 | −5,26 | ||||
| 2026-02-17 | 13F | Amundi | 1 058 866 | 0,00 | 2 118 | −0,52 | ||||
| 2026-02-13 | 13F | Van Eck Associates Corp | 357 747 | −4,21 | 1 | |||||
| 2025-11-14 | 13F | Raymond James Financial Inc | 0 | −100,00 | 0 | |||||
| 2025-09-26 | NP | RTXAX - Tax-Managed Real Assets Fund Class A | 225 906 | 0,00 | 409 | −4,23 | ||||
| 2026-02-12 | 13F | Advisors Asset Management, Inc. | 652 018 | 4,64 | 1 304 | −0,76 | ||||
| 2026-02-17 | 13F | XTX Topco Ltd | 259 105 | 34,07 | 518 | 27,27 | ||||
| 2025-11-14 | 13F | Eqis Capital Management, Inc. | 0 | −100,00 | 0 | |||||
| 2026-02-12 | 13F | Dimensional Fund Advisors Lp | 1 078 963 | 4,77 | 2 158 | −0,69 | ||||
| 2026-02-13 | 13F | Stifel Financial Corp | 775 601 | 11,21 | 1 551 | 5,44 | ||||
| 2025-11-06 | 13F | Wealthstream Advisors, Inc. | 15 247 | 25,77 | 32 | 39,13 | ||||
| 2026-01-28 | 13F | Geneos Wealth Management Inc. | 15 344 | 0,00 | 31 | −6,25 | ||||
| 2025-09-29 | NP | CVY - Invesco Zacks Multi-Asset Income ETF This fund is a listed as child fund of Invesco Ltd. and if that institution has disclosed ownership in this security, then these positions will not be double counted when calculating total shares and total value | 574 528 | −7,74 | 1 040 | −11,65 | ||||
| 2026-01-14 | 13F | Generali Investments CEE, investicni spolecnost, a.s. | 894 044 | 0,98 | 1 788 | −4,28 | ||||
| 2026-02-12 | 13F | Renaissance Technologies Llc | 7 385 748 | −10,74 | 14 771 | −15,40 | ||||
| 2026-02-03 | 13F | Ballentine Partners, LLC | 31 858 | −5,70 | 64 | −11,27 | ||||
| 2026-02-12 | 13F | Triumph Capital Management | 21 440 | 0,00 | 43 | −6,67 | ||||
| 2026-02-11 | 13F | O'shaughnessy Asset Management, Llc | 80 905 | 19,59 | 162 | 13,38 | ||||
| 2026-02-12 | 13F | Xponance, Inc. | 24 487 | 11,97 | 49 | 4,35 | ||||
| 2026-02-13 | 13F | Truvestments Capital Llc | 357 | 0,00 | 1 | |||||
| 2026-02-13 | 13F | Citigroup Inc | 495 467 | −32,65 | 991 | −36,21 | ||||
| 2026-02-17 | 13F | Quantinno Capital Management LP | 0 | −100,00 | 0 | |||||
| 2026-02-11 | 13F | West Family Investments, Inc. | 48 029 | 0,00 | 96 | −4,95 | ||||
| 2025-11-20 | 13F | First Affirmative Financial Network | 92 258 | 5,40 | 195 | 13,45 | ||||
| 2026-02-13 | 13F | SPX Equities Gestao de Recursos Ltda | 354 805 | 10,61 | 710 | 4,88 | ||||
| 2026-01-30 | 13F | Mitsubishi UFJ Trust & Banking Corp | 36 037 | −6,00 | 72 | −10,00 | ||||
| 2026-02-05 | 13F | Allworth Financial LP | 864 | −37,12 | 2 | −50,00 | ||||
| 2026-01-15 | 13F | Nisa Investment Advisors, Llc | 3 114 | 3,80 | 6 | 0,00 | ||||
| 2026-02-17 | 13F | Modern Wealth Management, LLC | 48 796 | −0,16 | 98 | −5,83 | ||||
| 2026-02-13 | 13F | Morgan Stanley | 3 946 057 | 1,60 | 7 892 | −3,70 | ||||
| 2026-02-17 | 13F | Point72 Asset Management, L.P. | 0 | −100,00 | 0 | |||||
| 2026-01-26 | 13F | PDS Planning, Inc | 41 721 | 0,00 | 83 | −5,68 | ||||
| 2026-01-30 | 13F | Us Bancorp \de\ | 54 014 | 25,63 | 108 | 20,00 | ||||
| 2026-02-13 | 13F | VPR Management LLC | 147 547 | 0,00 | 295 | −5,14 | ||||
| 2026-02-05 | 13F | Atria Investments Llc | 291 996 | 0,80 | 584 | −4,58 | ||||
| 2026-02-13 | 13F | Ieq Capital, Llc | 32 053 | −30,32 | 64 | −34,02 | ||||
| 2026-02-17 | 13F | Citadel Advisors Llc | Call | 0 | −100,00 | 0 | ||||
| 2026-02-12 | 13F | Jane Street Group, Llc | 455 899 | 76,69 | 912 | 67,46 | ||||
| 2025-09-25 | NP | DFCEX - Emerging Markets Core Equity Portfolio - Institutional Class This fund is a listed as child fund of Dimensional Fund Advisors Lp and if that institution has disclosed ownership in this security, then these positions will not be double counted when calculating total shares and total value | 308 387 | 0,00 | 558 | −4,12 | ||||
| 2026-02-11 | 13F | Group One Trading, L.p. | Put | 0 | −100,00 | 0 | −100,00 | |||
| 2026-03-06 | 13F | Hsbc Holdings Plc | 1 173 835 | 29,76 | 2 348 | 23,01 | ||||
| 2026-01-28 | 13F | CAPROCK Group, Inc. | 15 950 | −8,22 | 35 | −2,86 | ||||
| 2026-02-13 | 13F | Great West Life Assurance Co /can/ | 697 707 | 3,45 | 1 | 0,00 | ||||
| 2026-02-17 | 13F | United Capital Financial Advisers, Llc | 2 208 713 | −2,78 | 4 417 | −7,84 | ||||
| 2025-12-18 | 13F | Danske Bank A/s | 0 | −100,00 | 0 | |||||
| 2026-02-17 | 13F | Qube Research & Technologies Ltd | 184 220 | 174,32 | 368 | 160,99 | ||||
| 2026-02-17 | 13F | Russell Investments Group, Ltd. | 444 740 | 7,58 | 889 | 1,95 | ||||
| 2026-01-14 | 13F | Jfs Wealth Advisors, Llc | 585 | 0,00 | 1 | 0,00 | ||||
| 2026-02-05 | 13F | Bessemer Group Inc | 980 | 0 | ||||||
| 2026-02-13 | 13F | Integrated Wealth Concepts LLC | 0 | −100,00 | 0 | |||||
| 2026-02-05 | 13F | Everstar Asset Management, LLC | 550 276 | 10,43 | 1 101 | 4,66 | ||||
| 2026-01-27 | 13F | Checchi Capital Advisers, LLC | 11 933 | 0,00 | 24 | −8,00 | ||||
| 2026-02-10 | 13F | Eurizon Capital SGR S.p.A. | 56 506 | 115 | ||||||
| 2026-02-17 | 13F | Millennium Management Llc | 338 665 | −76,98 | 677 | −78,19 | ||||
| 2026-02-12 | 13F | BRYN MAWR TRUST Co | 0 | −100,00 | 0 | −100,00 | ||||
| 2026-02-12 | 13F | BlackRock, Inc. | 19 646 670 | 3,22 | 39 293 | −2,16 | ||||
| 2026-02-10 | 13F | Bank of New York Mellon Corp | 11 108 | −19,77 | 22 | −24,14 | ||||
| 2026-01-30 | 13F | R Squared Ltd | 25 782 | −47,66 | 52 | −50,49 | ||||
| 2026-02-13 | 13F | Smartleaf Asset Management LLC | 790 | 0,00 | 2 | 0,00 | ||||
| 2026-02-17 | 13F | Advisor Group Holdings, Inc. | 8 870 | −2,19 | 18 | −5,56 | ||||
| 2026-02-18 | 13F | EP Wealth Advisors, Inc. | 16 490 | 33 | ||||||
| 2026-02-06 | 13F | Gsa Capital Partners Llp | 0 | −100,00 | 0 | |||||
| 2025-11-14 | 13F | Wetherby Asset Management Inc | 207 957 | −0,39 | 439 | 7,09 | ||||
| 2026-01-23 | 13F | BSW Wealth Partners | 16 506 | 33 | ||||||
| 2026-02-12 | 13F | CIBC Private Wealth Group, LLC | 1 | 0,00 | 0 | |||||
| 2026-01-08 | 13F | Tuttle Tactical Management LLC | 26 104 | 52 | ||||||
| 2026-02-13 | 13F | Ariadne Wealth Management, LP | 13 650 | −36,10 | 31 | −34,78 | ||||
| 2026-01-27 | 13F | WealthCollab, LLC | 1 944 | 0,00 | 4 | −25,00 | ||||
| 2026-01-16 | 13F | Empirical Financial Services, LLC d.b.a. Empirical Wealth Management | 59 585 | −77,85 | 119 | −79,01 | ||||
| 2026-02-17 | 13F | Creative Planning | 102 501 | −1,51 | 205 | −6,39 | ||||
| 2026-02-13 | 13F | Schroder Investment Management Group | 158 039 | 17,30 | 322 | 13,38 | ||||
| 2025-11-07 | 13F | Sierra Ocean, Llc | 0 | −100,00 | 0 | |||||
| 2026-02-17 | 13F | Brevan Howard Capital Management LP | 0 | −100,00 | 0 | |||||
| 2026-02-05 | 13F | LGT Group Foundation | 34 085 | 0,00 | 70 | 0,00 | ||||
| 2026-02-10 | 13F | Goldman Sachs Group Inc | 19 464 437 | 99,35 | 38 929 | 88,96 | ||||
| 2026-01-21 | 13F | Greenleaf Trust | 456 833 | 0,00 | 914 | −5,19 | ||||
| 2026-01-23 | 13F | Assetmark, Inc | 386 | 1 |